
Logging to App Insights from Non-Azure Code
The Problem
We’ve seen the glory of App Insights. We want the pretty charts, and all the deep tracking. But we’re on a legacy system, not a cloud service running in Azure. Are we forever out in the cold, looking through a window at the luxurious comfort within?
Of course not! Microsoft has an extensive list of libraries that will push data to App Insights from a wide variety of application frameworks. They also offer a REST API to query that data (similar to queries you can run within App Insights Analytics).
This post will narrate a small application that demonstrates two things:
- publishing custom info to App Insights (in this case, from javascript)
- querying App Insights and feeding the results into a “non-App-Insights” graphic solution (again, in javascript using a REST API and ChartJS)
While the example is simple and somewhat meaningless, it should provide a starting point for developers looking to do REAL things with App Insights.
Collecting Information
Simply put, the App Insights SDK allows us to send data to Azure App Insights. There are several categories of information we can record:
- Requests - timings, environment info, as well as custom telemetry info
- Exceptions - log all types of exceptions from an application
- Custom Events - collect anything under the sun about an application
- Custom Metrics - numbers, numbers, numbers, measure and track history.
- Performance Counters - performance logs from servers
…and much more. This information is covered in more detail here.
The sample app uses the App Insights Javascript SDK to send custom events to App Insights. This can be accomplished with a few chunks of javascript…
Javascript Chunk #1 - Initialization
Using a garbled, impossible to read javascript snippet provided by Microsoft, we initialize our JS environment for writing to App Insights (and establish the window.appInsights variable in the process):
<script type="text/javascript">
    var appInsights = window.appInsights || function (a) {
        function b(a) { c[a] = function () { var b = arguments; c.queue.push(function () { c[a].apply(c, b) }) } } var c = { config: a }, d = document, e = window; setTimeout(function () { var b = d.createElement("script"); b.src = a.url || "https://az416426.vo.msecnd.net/scripts/a/ai.0.js", d.getElementsByTagName("script")[0].parentNode.appendChild(b) }); try { c.cookie = d.cookie } catch (a) { } c.queue = []; for (var f = ["Event", "Exception", "Metric", "PageView", "Trace", "Dependency"]; f.length;)b("track" + f.pop()); if (b("setAuthenticatedUserContext"), b("clearAuthenticatedUserContext"), b("startTrackEvent"), b("stopTrackEvent"), b("startTrackPage"), b("stopTrackPage"), b("flush"), !a.disableExceptionTracking) { f = "onerror", b("_" + f); var g = e[f]; e[f] = function (a, b, d, e, h) { var i = g && g(a, b, d, e, h); return !0 !== i && c["_" + f](a, b, d, e, h), i } } return c
    }({
        instrumentationKey: '@ViewData.Model.AppInsightsKey'
    });

    window.appInsights = appInsights, appInsights.queue && 0 === appInsights.queue.length && appInsights.trackPageView();
</script>
Note the “instrumentationKey” value is obtained from the App Insight instance within Azure Portal, and is populated here by an MVC view model variable.
Javascript Chunk #2 - Writing the Event
With the appInsights variable established, we can use it to write all the different types of information to App Insights. In this example, the code is logging a custom event containing “clickCount” and a message (from within a Vue click handler):
    this.clickCount++;
    var properties = {"message": this.appInsightsMessage };
    var metrics = {"clickCount": this.clickCount };
    appInsights.trackEvent("IndexClick", properties, metrics);
    appInsights.flush();
Here’s what the (incredibly simple) UI looks like after clicking a few times:
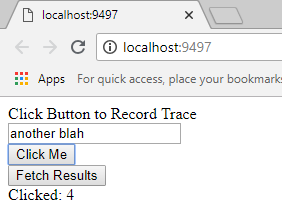
Recording Clicks
Querying Data
App Insight’s visualization capabilities are extensive, but don’t currently support embedding an charts in an external system (I believe the MSFT recommendation is exporting to Power BI). However, they do support a REST API that can retrieve all the data, and with the plethora of javascript charting/graphing solutions, it’s fairly straightforward wiring something up yourself. These examples are using the Axios JS library to invoke REST API calls.
Javascript Chunk #3 - Establish Axios Bits
To begin, we’ll setup a variable that contains the necessary “base” information for our query to the App Insights REST API:
    // Establish our "base" URL, complete with App Insights keys provided by MVC View Model variable:
    appInsightsUrl = axios.create({
        baseURL: 'https://api.applicationinsights.io/v1/apps/@ViewData.Model.AppInsightsApplicationId',
        headers: {
            'x-api-key': '@ViewData.Model.AppInsightsRestApiKey'
        }
    });
Again, the keys are obtained from the App Insight instance within Azure Portal, and are populated with MVC view model variables.
Javascript Chunk #4 - Querying with REST API
And within another Vue click event handler, we can do the following to query App Insights:
    var self = this;
    self.loading = true;
    // Query is a URL encoded represetion of "customEvents | order by timestamp desc", and the "timespan" parameter
    //  limits results to past 24 hours.
    appInsightsUrl.get('query?timespan=PT24H&query=customEvents%20|%20order%20by%20timestamp%20desc')
        .then(response => {
            this.events = response.data.tables[0].rows.map(i => {
                return {
                    timestamp: i[0],
                    clickCount: i[4] ? JSON.parse(i[4]).clickCount : "?",
                    message: i[3] ? JSON.parse(i[3]).message : "?"
                }
            });
            self.loading = false;
        })
        .catch(e => {
            self.loading = false;
        });
Here’s a screenshot of the sample app, complete with a list of App Insights goodness:
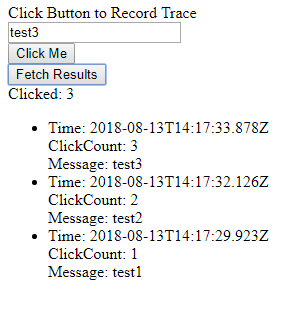
Simple App Insights Rendering Goodness
Visualizing Data
While the data we store and retrieve from App Insights can be very useful by itself, what’s the point if we don’t have a shiny, pretty graph? This is easy to do with all the javascript libraries available. For this example, I used Chart JS.
            drawChart: function () {
                // Render a chart from our app insights data
                var ctx = document.getElementById("myChart").getContext('2d');
                new Chart(ctx, {
                    type: 'line',
                    data: {
                        datasets: [
                            {
                                label: 'App Insights Clicks',
                                backgroundColor: "#00FF00",
                                borderColor: "#0000FF",
                                // Map data to fit what chartJS timeline is expecting
                                data: this.events.map(e => {
                                        return {
                                            x: new Date(e.timestamp),
                                            y: e.clickCount
                                        };
                                    })
                            }
                            ]
                    },
                    options: {
                        scales: {
                            xAxes: [{
                                type: 'time',
                                distribution: 'linear'
                            }]
                        }
                    }
                });

            }
And the colorful, vibrant result!
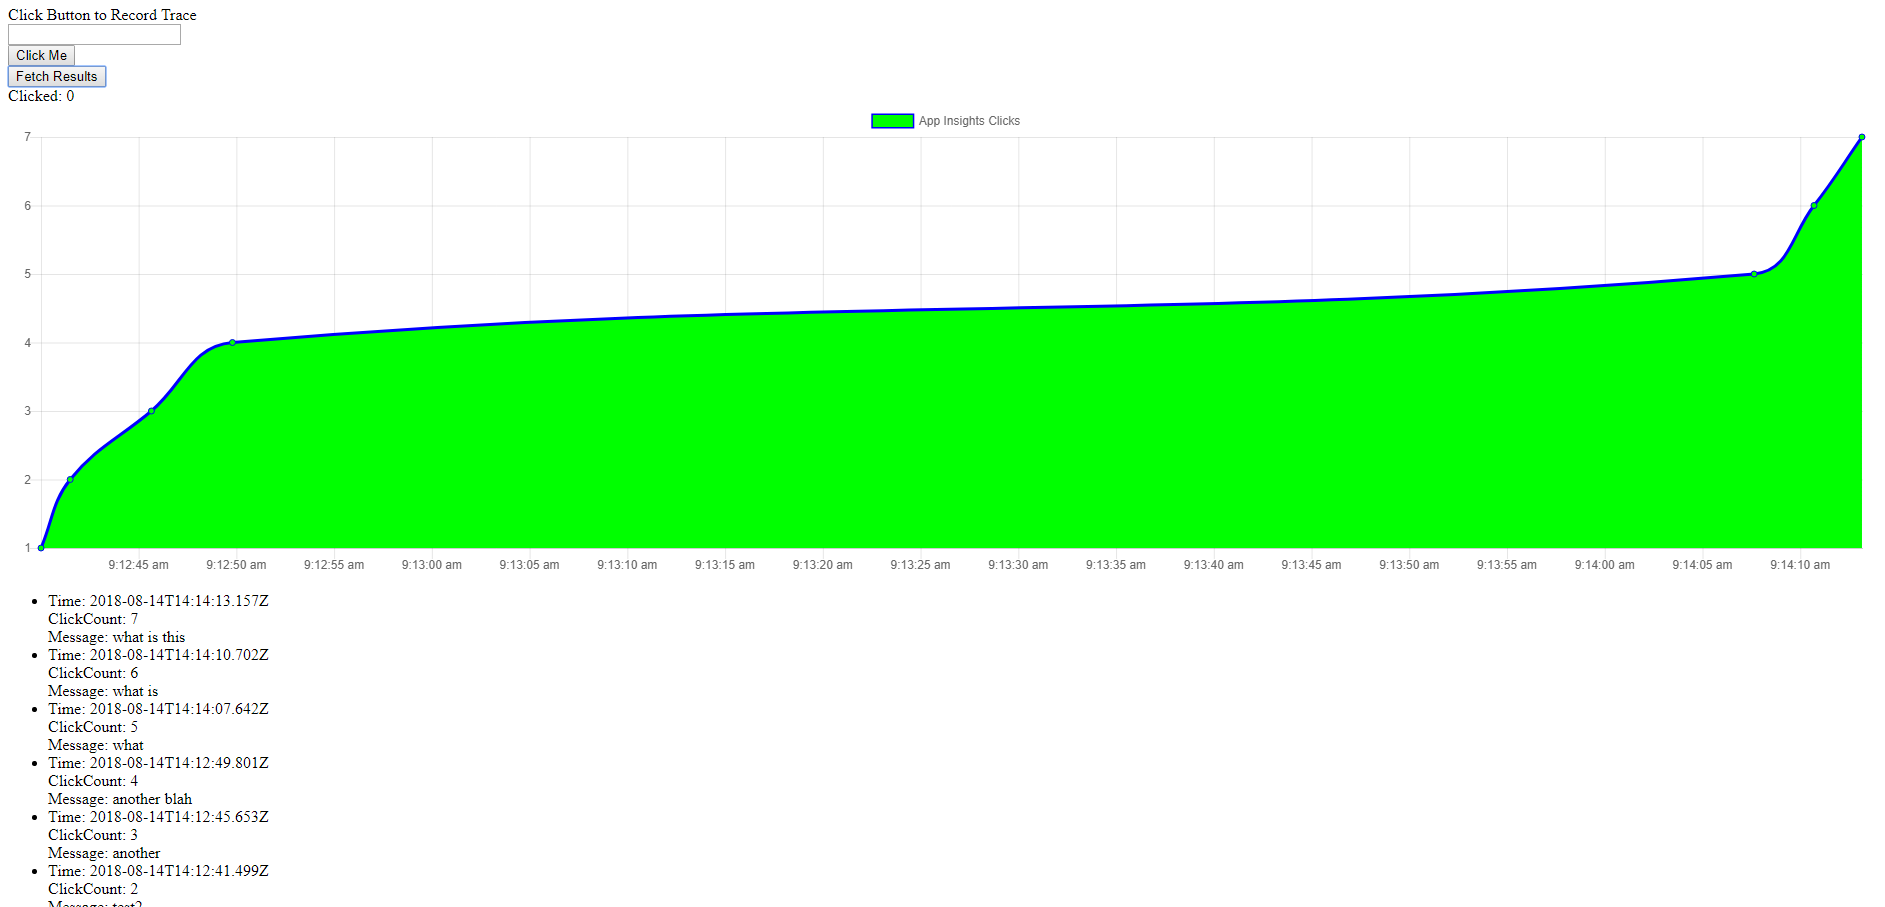
Wonderful, Snappy Graphics!
While this example is a bit silly, it should illustrate how App Insights data can be captured and displayed. There’s something so satisfying about rendering these graphics!
From here...
Hopefully this sample exercise lends some ideas towards how to use App Insights to capture application data, and render it in a useful manner in a custom application. Thanks for reading!